
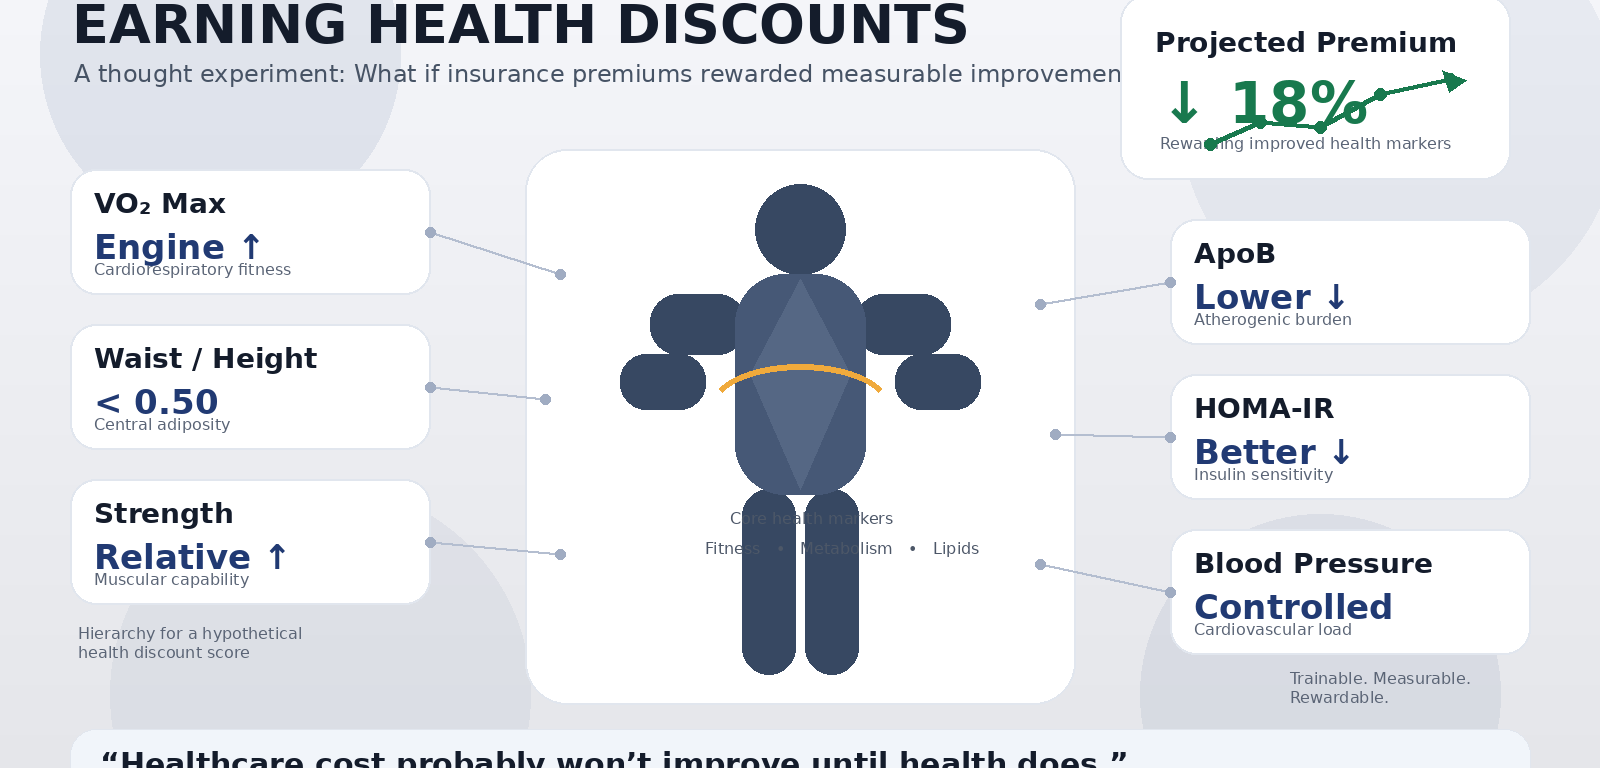
An actuarial thought experiment: earning discounts by improving the things we can actually control
I have a hypothesis I repeat whenever the conversation turns to the rising cost of medicine:
Healthcare cost probably won’t improve until health does.
That statement is obviously incomplete. Hospital pricing, insurance administration, drug costs, incentives, regulation, demographics and many other factors affect what Americans pay for healthcare.
But there is another side of the ledger that is harder to ignore: unhealthy populations are expensive populations.
Physical inactivity alone has been estimated to account for roughly 11% of aggregate U.S. healthcare expenditures. Among privately insured adults in a recent analysis, obesity was associated with approximately 22% higher medical expenditures than healthy weight, with costs rising substantially at more severe levels of obesity.
That led me to an interesting thought experiment.
What if, instead of thinking about health insurance strictly as something that penalizes illness, we imagined a system where you could earn discounts by improving measurable health and physical capacity?
Not steps on a smartwatch. Not completing an online wellness questionnaire.
Actual physiology.
Imagine receiving an annual physical and being handed something resembling an actuarial scorecard:
Your VO₂ max improved. Discount earned.
Your waist came down relative to your height. Discount earned.
Your blood pressure improved. Discount earned.
Your insulin sensitivity improved. Discount earned.
Your ApoB declined. Discount earned.
You’re stronger than last year. Discount earned.
The point isn’t to design an actual insurance product. It is to ask a more useful question:
If we only included measurements that can be meaningfully influenced through training, diet and lifestyle, which ones deserve the most weight?
Here is how I would rank them.
1. Cardiorespiratory fitness: the engine
If I could select only one physical-performance measurement, it would probably be cardiorespiratory fitness.
VO₂ max is essentially a measurement of how effectively the cardiovascular and respiratory systems deliver oxygen and how effectively the body uses it during demanding exercise.
The epidemiological data are remarkable.
A 2024 overview synthesized 26 systematic reviews representing more than 20.9 million observations from 199 cohort studies. People with high cardiorespiratory fitness had about a 53% lower risk of all-cause mortality than those with low fitness. Each additional 1 MET of fitness was associated with roughly an 11–17% reduction in all-cause mortality risk.
And this isn’t merely a mortality association.
In the Veterans Exercise Testing Study, involving 9,942 people, each additional 1 MET of fitness was associated with $1,592 lower annual healthcare costs, after adjustment for demographic and clinical variables. The least-fit quartile incurred roughly $14,662 more healthcare spending per person per year than the fittest quartile.
Another analysis found that the association between fitness and lower healthcare expenditures persisted across normal-weight, overweight and obese groups.
That is extraordinarily relevant to this thought experiment.
What would I measure?
Ideally:
VO₂ max or maximal MET capacity, adjusted for age and sex.
For a practical field test:
1-mile or 1.5-mile run time, Cooper test performance, or another validated estimate of aerobic capacity.
I would prefer an age- and sex-adjusted percentile rather than simply rewarding the largest raw VO₂ max.
Hypothetical weighting: 25%
2. Central adiposity: the storage problem
If the first metric measures the size of your engine, the second should probably measure where excess energy is being stored.
I wouldn’t make BMI the primary measurement.
I wouldn’t even make body-fat percentage the primary measurement.
I would use:
Waist-to-height ratio
That is simply:
Waist circumference ÷ height
Why?
Because abdominal and visceral adiposity appear to carry considerably more cardiometabolic information than total body mass alone.
A 2023 systematic review and meta-analysis found that people in higher waist-to-height categories had approximately 23% greater all-cause mortality and 39% greater cardiovascular mortality than people in lower categories.
It also solves one of the obvious problems with BMI.
A muscular 220-pound athlete and a sedentary 220-pound individual of equal height may have identical BMIs while possessing profoundly different physiology.
Their waists probably tell a different story.
The healthcare-cost relationship with obesity is also difficult to dismiss. In a study of more than 700,000 privately insured adults, obesity was associated with $1,776 greater annual medical expenditure than healthy weight; expenditure increased further at very high BMI levels.
A separate analysis estimated that among people with employer-sponsored insurance and obesity, a 5% reduction in weight was associated with approximately $670 less annual healthcare spending, while larger weight reductions were associated with progressively larger savings. That study was observational/model-based rather than proof that weight loss itself caused every dollar of savings, but the relationship is economically meaningful.
What would I measure?
Waist-to-height ratio
Body-fat percentage could be retained as a secondary measurement, particularly when accurately assessed.
But I would score central adiposity before total adiposity.
Hypothetical weighting: 20%
3. Blood pressure: the pressure gauge
Blood pressure belongs near the top because it represents both enormous disease burden and something many people can meaningfully influence through:
- weight reduction
- aerobic exercise
- resistance training
- sodium/potassium balance
- alcohol moderation
- improved sleep
- dietary quality
Historically, analyses of global disease burden have attributed enormous numbers of cardiovascular events and deaths to elevated blood pressure. One major analysis estimated that non-optimal blood pressure accounted for approximately two-thirds of stroke and half of ischemic heart disease globally.
More recent Global Burden of Disease analyses continue to identify elevated systolic pressure as one of the dominant cardiovascular risk factors worldwide.
There is also an advantage from an actuarial standpoint:
Blood pressure is cheap, objective, repeatable and highly scalable.
What would I measure?
Probably an average of multiple properly performed home measurements rather than one nervous reading in a doctor’s office.
Resting systolic and diastolic blood pressure
Hypothetical weighting: 15%
4. Insulin sensitivity: the fuel-management system
Fasting glucose can look perfectly respectable for years while the pancreas compensates by producing progressively more insulin.
That makes insulin resistance interesting.
If we’re trying to measure physiology rather than simply diagnose established diabetes, I’d prefer:
HOMA-IR
which incorporates fasting glucose and fasting insulin.
A meta-analysis in adults without diabetes found that people in the highest HOMA-IR category had approximately 34% greater all-cause mortality than those in the lowest category. The association with cardiovascular mortality was even larger, although it was based on fewer studies and therefore carries more uncertainty.
Fasting insulin alone was less consistently predictive, which is why I would not simply award points for having low insulin without considering glucose.
This category also overlaps meaningfully with waist circumference, physical activity and diet—which is exactly what we’d expect biologically.
What would I measure?
HOMA-IR
with HbA1c and fasting glucose as supporting measurements.
Hypothetical weighting: 15%
5. ApoB: how much atherogenic traffic is on the road?
Traditional cholesterol panels tell us how much cholesterol is being transported.
Apolipoprotein B gives us information about the number of atherogenic particles doing the transporting.
Each atherogenic LDL, VLDL-remnant, IDL and Lp(a) particle contains one ApoB molecule, making ApoB a useful approximation of particle number.
The National Lipid Association’s 2024 expert consensus concluded that ApoB more accurately reflects atherogenic burden than LDL cholesterol in important circumstances and that when ApoB and LDL-C disagree, cardiovascular risk generally tracks more closely with ApoB or non-HDL cholesterol.
This is slightly different from the previous categories because genetics can strongly influence ApoB.
You cannot out-train familial hypercholesterolemia.
But ApoB can often be favorably affected through dietary composition, weight management and improvements in metabolic health—and medication when lifestyle isn’t enough.
That makes it worthy of inclusion, while recognizing that the score should reward improvement as well as absolute level.
What would I measure?
ApoB concentration
Potentially with separate consideration of Lp(a), although I would not include Lp(a) in an “earn your discount” score because Lp(a) is predominantly genetically determined and therefore violates the premise of our experiment.
Hypothetical weighting: 10%
6. Strength: the chassis
Here’s where the exercise scientist in me wants to put the bench press, squat and deadlift on the insurance application.
The epidemiology won’t quite let me.
The strongest population-level evidence is for simpler standardized measurements such as grip strength, not powerlifting totals.
But the signal is strong.
A systematic review of 38 studies encompassing nearly 1.9 million people found that greater grip strength was associated with approximately a 31% lower risk of all-cause mortality. Greater knee-extension strength was also associated with lower mortality.
A separate meta-analysis of more than 3 million participants found that each 5-kg decrease in grip strength was associated with approximately:
- 16% higher all-cause mortality
- 21% higher cardiovascular disease risk
- 9% higher stroke risk
This probably doesn’t mean squeezing a gripper will make you immortal.
Grip strength is functioning partly as a marker of broader physiological robustness—muscular health, neural function, physical activity, frailty resistance and overall capacity.
For athletic populations, however, I think we can do better than grip alone.
What would I measure?
For a population-scale system:
Grip strength relative to body size and demographic norms
For an Asgard Athletica version:
Relative strength
For example:
Squat ÷ bodyweight
Deadlift ÷ bodyweight
Bench or press ÷ bodyweight
Perhaps averaged into a Relative Strength Index.
I would not reward raw 1RM because that would essentially give a premium discount for simply being a very large human.
Hypothetical weighting: 10%
7. Glycemic control: the long-view fuel gauge
HbA1c isn’t as interesting to me as insulin sensitivity in someone who is currently metabolically healthy, because A1c often becomes abnormal later in the process.
But it is inexpensive, standardized and clinically useful.
So I’d retain:
HbA1c
as a smaller independent category or as part of the metabolic-health score.
Hypothetical weighting: 5%
What I would not include
This is almost as important.
There are hundreds of measurable health variables. More data does not automatically produce a better score.
I would avoid heavily weighting metrics that duplicate information already represented elsewhere.
For example:
BMI + bodyfat + waist + waist-to-height
would over-count adiposity.
Likewise:
VO₂ max + mile time + resting heart rate + Cooper test
would largely measure overlapping aspects of cardiorespiratory fitness.
And:
fasting glucose + fasting insulin + HOMA-IR + HbA1c + triglyceride/glucose ratio
could turn one metabolic problem into five separate penalties.
A good actuarial model should identify independent domains of health, not reward someone five times for improving the same thing.
What about combining the numbers into ratios?
This gets tempting.
You could invent:
VO₂ max ÷ bodyfat percentage
or
VO₂ max × relative strength
or some grand:
Fitness-to-Fatness Ratio
They’re interesting—but I wouldn’t begin there.
A ratio is only scientifically useful when the ratio itself has demonstrated predictive value.
Waist-to-height ratio does.
The literature supporting VO₂ max/bodyfat percentage as an independent clinical risk predictor is nowhere near as mature.
And invented ratios can produce bizarre results.
Imagine two people:
Person A: VO₂ max 45, 15% bodyfat
Person B: VO₂ max 45, 10% bodyfat
Dividing the variables makes Person B’s “score” 50% better despite identical aerobic fitness. It’s unlikely that their actual health risk changed by anything approaching 50%.
Better to score the domains independently and then combine their percentile scores.
The hypothetical Health Discount Score
If I were building version 1 tomorrow, it might look like this:
| Physiological domain | Measurement | Weight |
|---|---|---|
| Engine | VO₂ max / age-sex percentile | 25% |
| Central adiposity | Waist-to-height ratio | 20% |
| Pressure | Resting blood pressure | 15% |
| Metabolic health | HOMA-IR | 15% |
| Arterial burden | ApoB | 10% |
| Chassis | Relative strength / grip strength | 10% |
| Long-term glucose | HbA1c | 5% |
Those percentages are not validated actuarial coefficients. They are my proposed hierarchy based on three criteria:
1. How strongly does the measurement associate with meaningful health outcomes?
2. How strongly is it connected with healthcare utilization or diseases that drive healthcare spending?
3. Can an individual realistically improve it through training, nutrition and other health behaviors?
That third rule is essential.
If the point is to reward behavior, I don’t want to financially punish someone for their genetics.
Earning discounts instead of avoiding penalties
This is where the exercise becomes more interesting.
Most health-risk conversations start with:
What’s wrong with you?
Maybe the better framework is:
What capacity have you earned?
Run faster? Earn points.
Increase your VO₂ max? Earn points.
Take two inches off your waist while preserving muscle? Earn points.
Bring blood pressure down? Earn points.
Improve insulin sensitivity? Earn points.
Increase relative strength? Earn points.
Lower ApoB through diet, body-composition changes or appropriate medical treatment? Earn points.
Suddenly health stops being merely the absence of disease.
It becomes something you build.
And that is much closer to how training actually works.
The fittest person isn’t necessarily the leanest person
There’s another reason I would put VO₂ max above bodyfat.
One of the most interesting observations in the healthcare-cost literature is that fitness appears to modify some of the economic burden associated with excess bodyweight.
In the Veterans Exercise Testing Study, healthcare costs increased with obesity—but within every BMI category, fitter individuals incurred considerably lower costs. The association between greater fitness and lower spending was particularly large among people with obesity.
That’s important.
It suggests that our hypothetical system shouldn’t simply reward being skinny.
A 210-pound person who:
- carries substantial muscle,
- has a strong aerobic engine,
- has good insulin sensitivity,
- maintains healthy blood pressure,
- has favorable ApoB,
- and demonstrates high physical capacity
is not physiologically equivalent to another 210-pound person just because the bathroom scale produces the same number.
Health isn’t a weight class.
Healthcare is downstream
None of this means exercise solves American healthcare economics.
It doesn’t.
Nor does it mean illness is always self-inflicted. Genetics, aging, infectious disease, accidents, cancer, autoimmune disease, socioeconomic circumstances and plain bad luck remain very real.
But healthcare is often downstream of physiology.
Cardiovascular disease is downstream.
Type 2 diabetes is downstream.
Hypertension is downstream.
Frailty is downstream.
Many orthopedic problems are at least partly downstream.
And the upstream variables are often surprisingly mundane:
Move.
Lift.
Develop an aerobic engine.
Carry enough muscle.
Don’t accumulate excessive visceral fat.
Eat food that supports metabolic health.
Sleep.
Recover.
Repeat for decades.
The economics eventually encounter the biology.
Which brings us back to the hypothesis:
Healthcare cost probably won’t improve until health does.
Perhaps the most productive way to think about that isn’t punishment.
It’s earning discounts.
What if every year you could walk into the metaphorical underwriting office stronger, leaner through the waist, more insulin-sensitive, more aerobically capable, with lower blood pressure and fewer atherogenic particles than the year before?
Maybe the most interesting question isn’t:
“What should healthy people pay for insurance?”
Maybe it’s:
“What measurable health improvements are valuable enough that we should reward people for earning them?”
That’s an actuarial exercise worth doing.

